Why you should use Topological Data Analysis over t-SNE or UMAP?
We compare the results generated from TDA with results from t-SNE and UMAP packages
The problem
Have you tried to run a complex supervised machine learning model, only to find unexpected patterns and inconsistencies that make your results unreliable? It's a common problem that can leave even the most experienced data scientists scratching their heads. But fear not! There's a new kid on the block that can help you uncover the hidden structure of your data: topological data analysis (TDA). We'll compare TDA with the popular t-SNE and UMAP packages and show you why TDA is the superhero of data analysis, capable of revealing the unexpected and saving the day.
Topological Data Analysis + Self-supervised ML
Topological Data Analysis (TDA) is a mathematical approach that helps in understanding and analyzing complex data. TDA uses topology to extract meaningful information from the data by studying the shape and structure of the data. Deep learning, and especially self-supervised learning, on the other hand, is a machine learning technique where a model learns from unlabeled data without the need for manual annotation.
Combining these two techniques allows topological features to be extracted from large amounts of unlabeled data and used to train self-supervised learning models. This approach has potential applications in fields such as computer vision, natural language processing, time-series (internet of things) and many other.
The main advantages of Deep TDA over t-SNE or UMAP
- Robustness: TDA is more robust to noise and outliers in the data compared to t-SNE and UMAP. This is because TDA is based on the topology of the data, which is more resistant to noise than geometric methods like t-SNE and UMAP.
- Multiscale Analysis: TDA can detect and represent the data structure at multiple scales, allowing for a more complete and nuanced understanding of the data. In contrast, t-SNE and UMAP are mainly designed to capture local structures in the data and may miss global structures.
- Ability to learn complex patterns: Self-supervised deep learning allows the model to learn complex, hierarchical representations of the data. This can be especially useful for high-dimensional data with non-linear relationships, which may be difficult to capture with methods like t-SNE and UMAP.
- Parameter-free: TDA is relatively parameter-free, which means that it does not require a lot of tuning or prior knowledge of the data. In contrast, t-SNE and UMAP require careful parameter selection to achieve good results.
- Scalability: TDA is scalable to large datasets, and recent advances in computational methods have made TDA more computationally efficient. This makes TDA suitable for analyzing complex and high-dimensional data sets that are often encountered in real-world applications.
Let's compare the results from a number of case studies.
Time-series case study
Time-series data refers to a type of data that is collected and recorded over time at regular intervals. Examples of time-series data include stock prices, weather measurements, and website traffic. In our case study we're analysing a data from our previous work AI for AI (artificial insemination) - Deep Topological Analysis for sensor data
These are the results generated from t-SNE and UMAP:
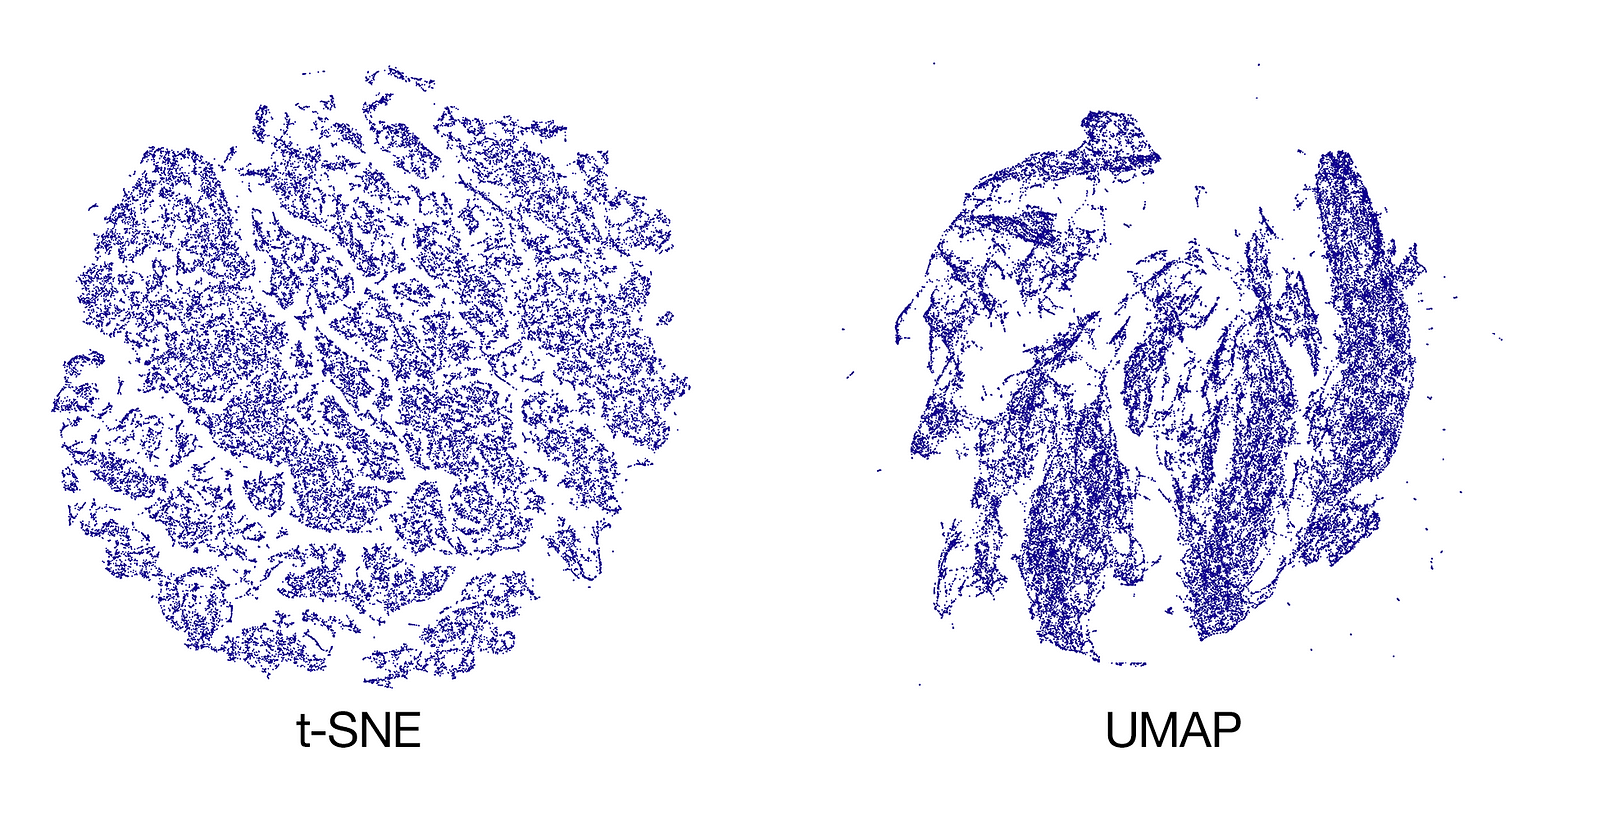
t-SNE here captures too much structure, most of which does not exist in the data. UMAP shows promising results, although the clusters are not as distinguished as TDA and the structure is somewhat blurry. Here the TDA result:
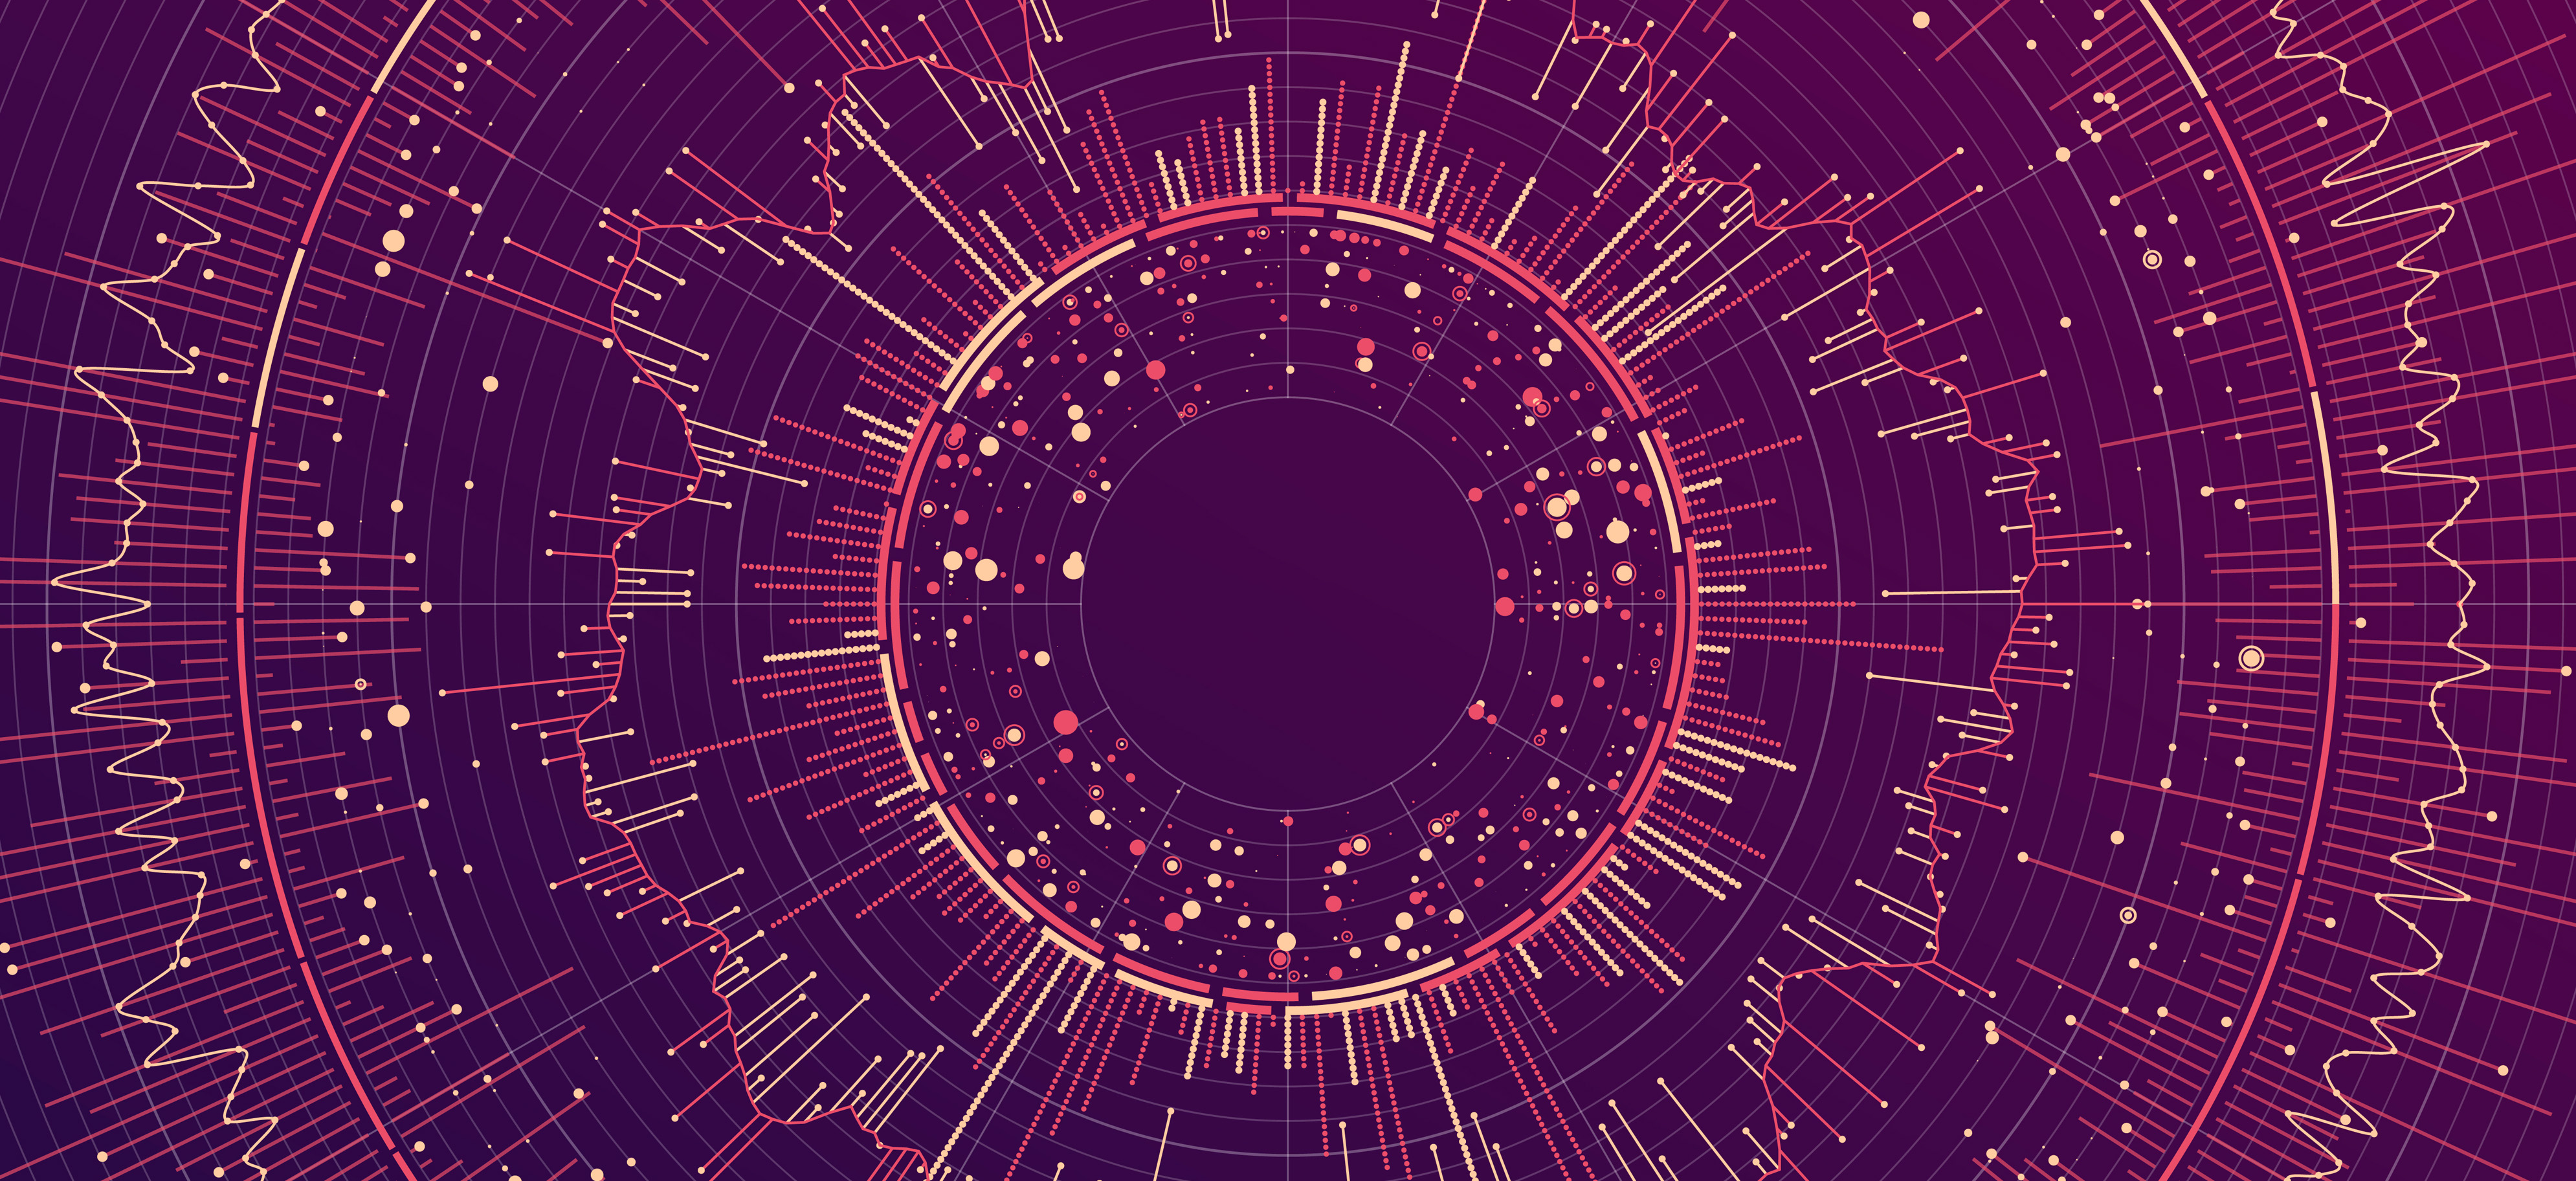
Every dot on this graph represents a 10 minutes window of every cow activity in the dataset. Dots placed together form clusters of unique activities.
By contrast, TDA maintains a lot of fine grained structure. We have evolved this approach over time and it's our preferred method of dealing with clustering problems.
Image analysis case study
For the image analysis case study we use the popular CIFAR100 image classification dataset. It consists of 60,000 32x32 color images in 100 classes, with 600 images per class. The classes in CIFAR100 are more fine-grained than those in CIFAR10, including subcategories like aquatic mammals, flowers, insects, and household furniture.
Every RGB pixel from the data was presented as three columns, in this case it will be 32 * 32 * 3 = 3,072 dimensions to process for each image. The final matrix is [60000, 3072] to process using t-SNE or UMAP:
import numpy as np
import pandas as pd
import matplotlib.pyplot as plt
from sklearn.datasets import fetch_openml
from sklearn.manifold import TSNE
from umap import UMAP

# Load the CIFAR100 dataset
cifar100 = fetch_openml(name='CIFAR_100')

# Extract the data
data = cifar100.data

# Perform dimensionality reduction using TSNE
tsne = TSNE(n_components=2, random_state=42)
data_tsne = tsne.fit_transform(data)

# Perform dimensionality reduction using UMAP
umap = UMAP(n_components=2, random_state=42)
data_umap = umap.fit_transform(data)

# Create a DataFrame with the reduced data
tsne_df = pd.DataFrame(data_tsne)
umap_df = pd.DataFrame(data_umap)

# Plot the reduced data using pandas plot
tsne_df.plot.scatter(x=0, y=1, c='DarkBlue', figsize=(50,50))
umap_df.plot.scatter(x=0, y=1, c='DarkBlue', figsize=(50,50))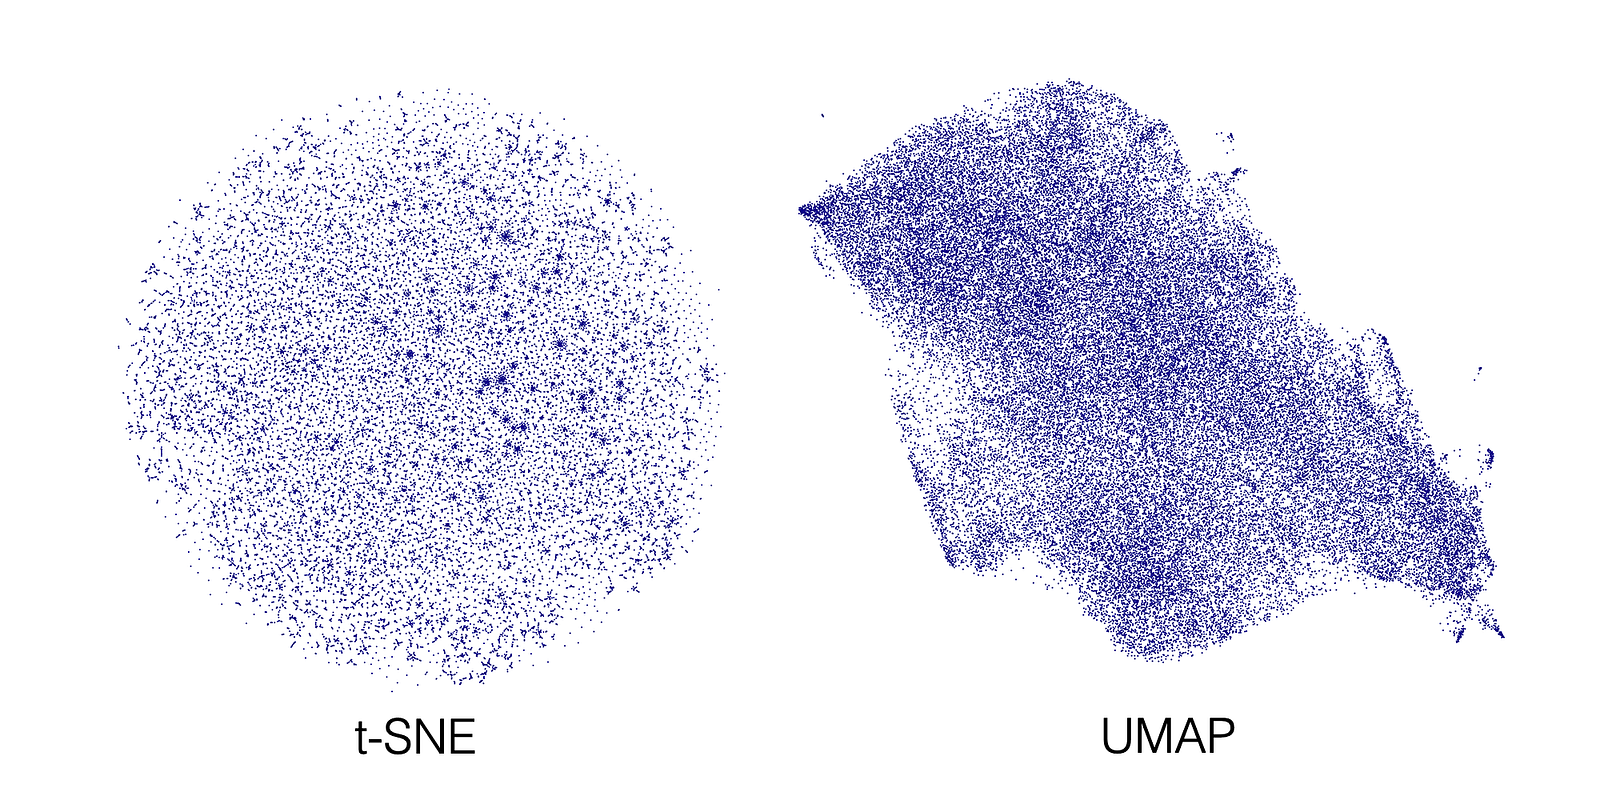
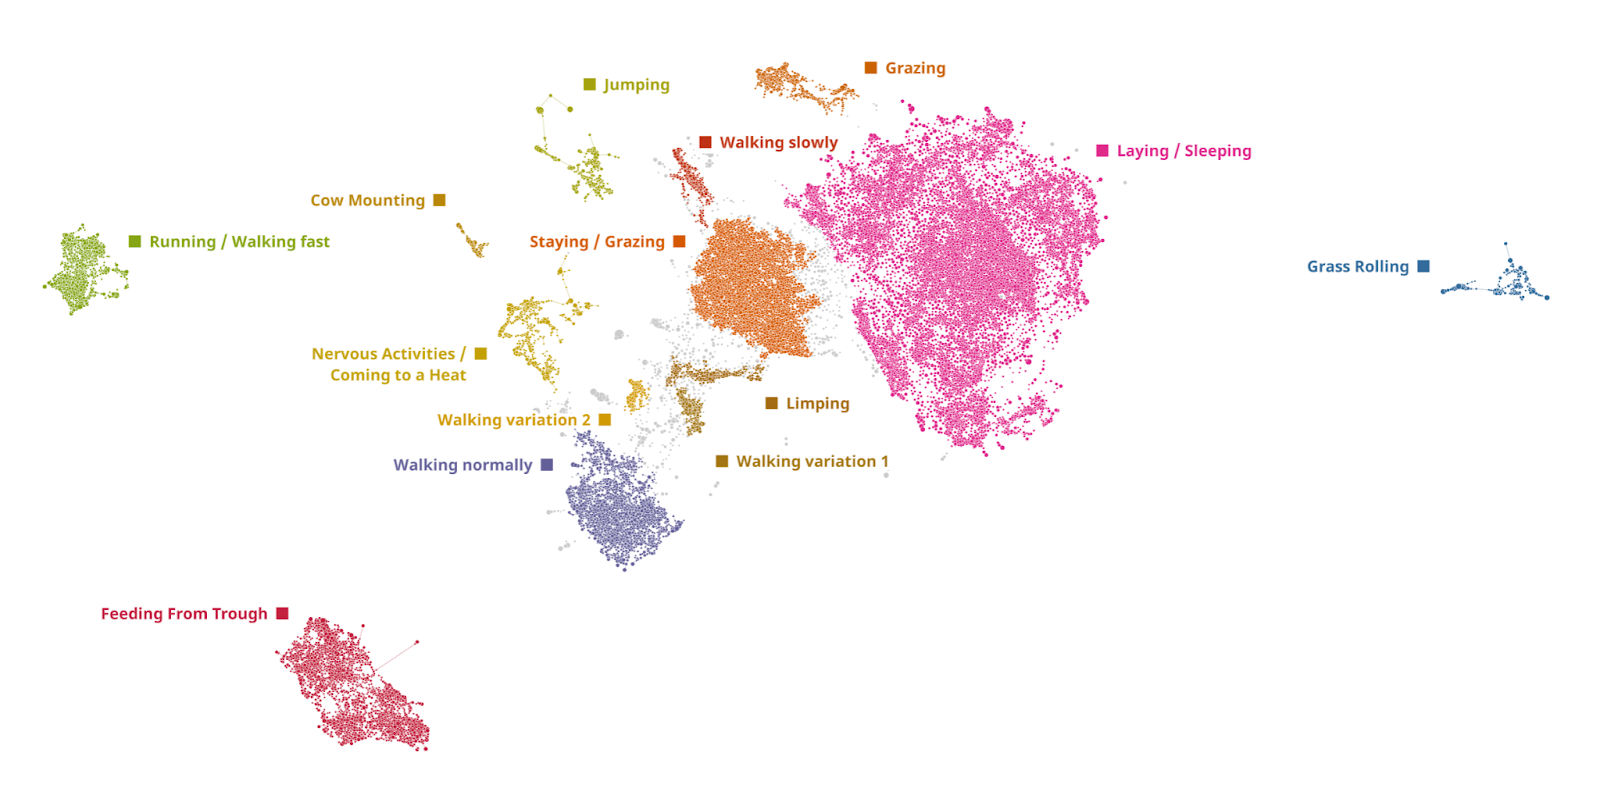
Unfortunately, this data is too complex for these algorithms to extract any meaningful structure. In contrast, just providing images to DataRefiner TDA gives us the following result (clusters are named from the most dominant categories in label column):
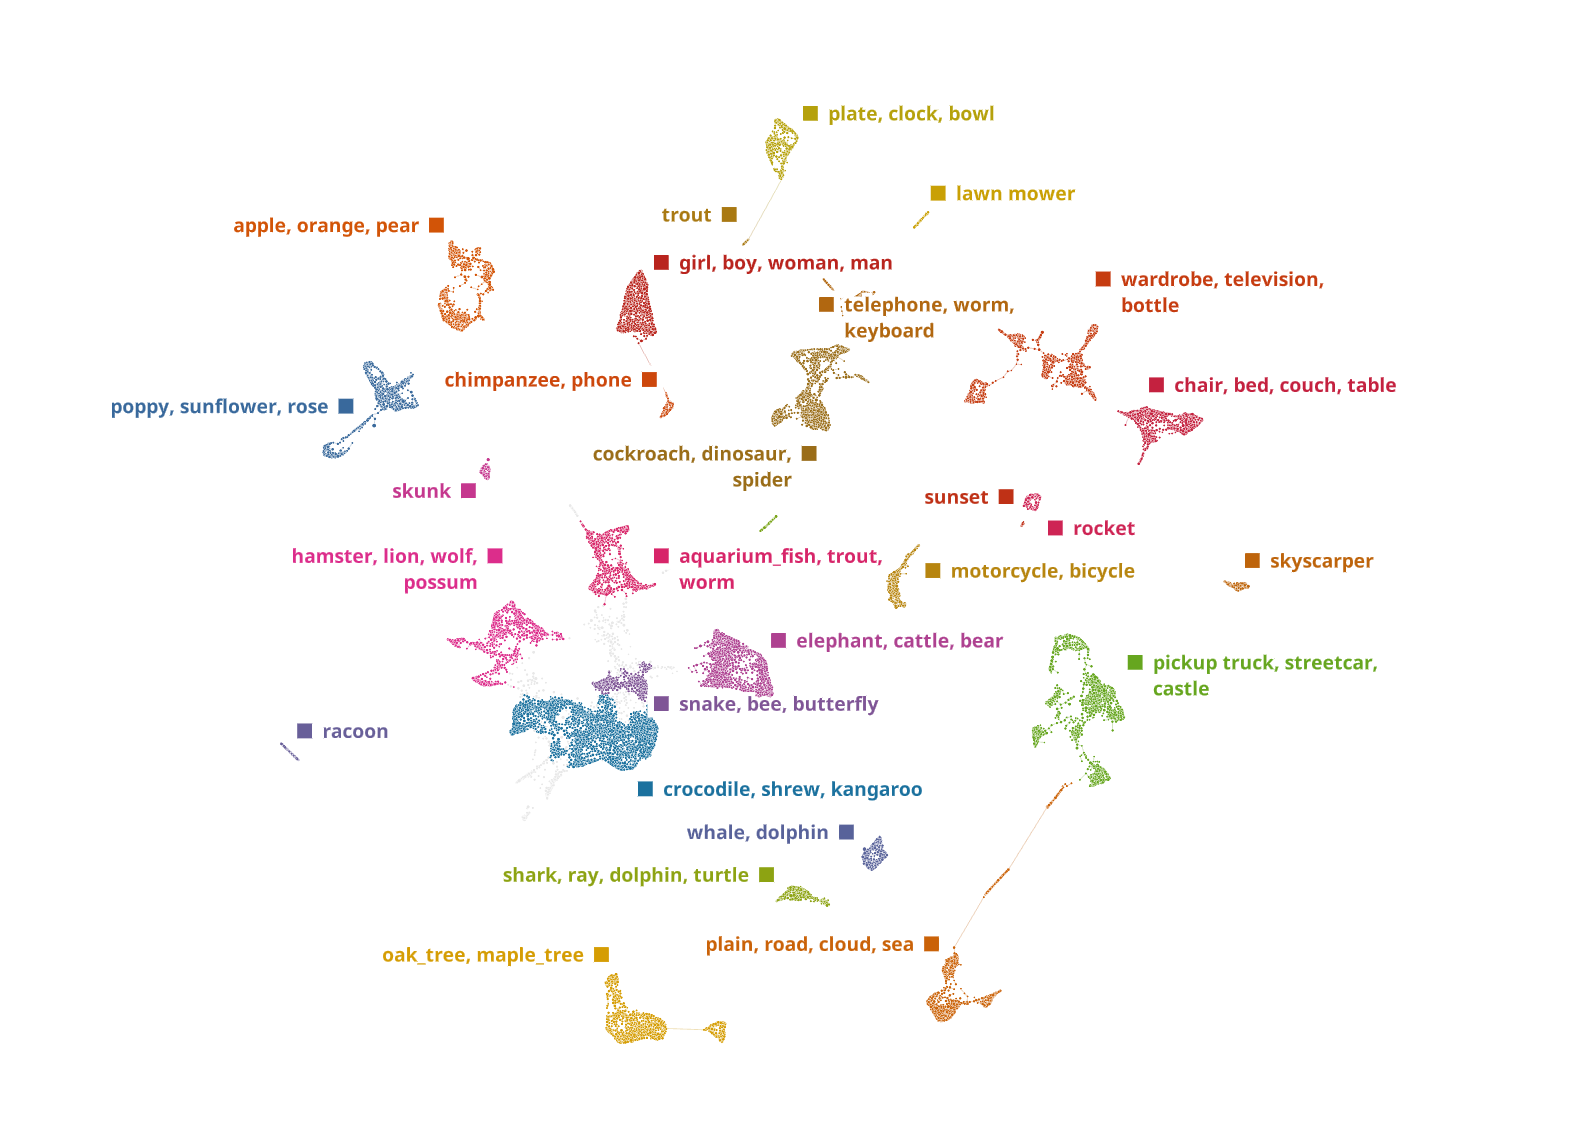
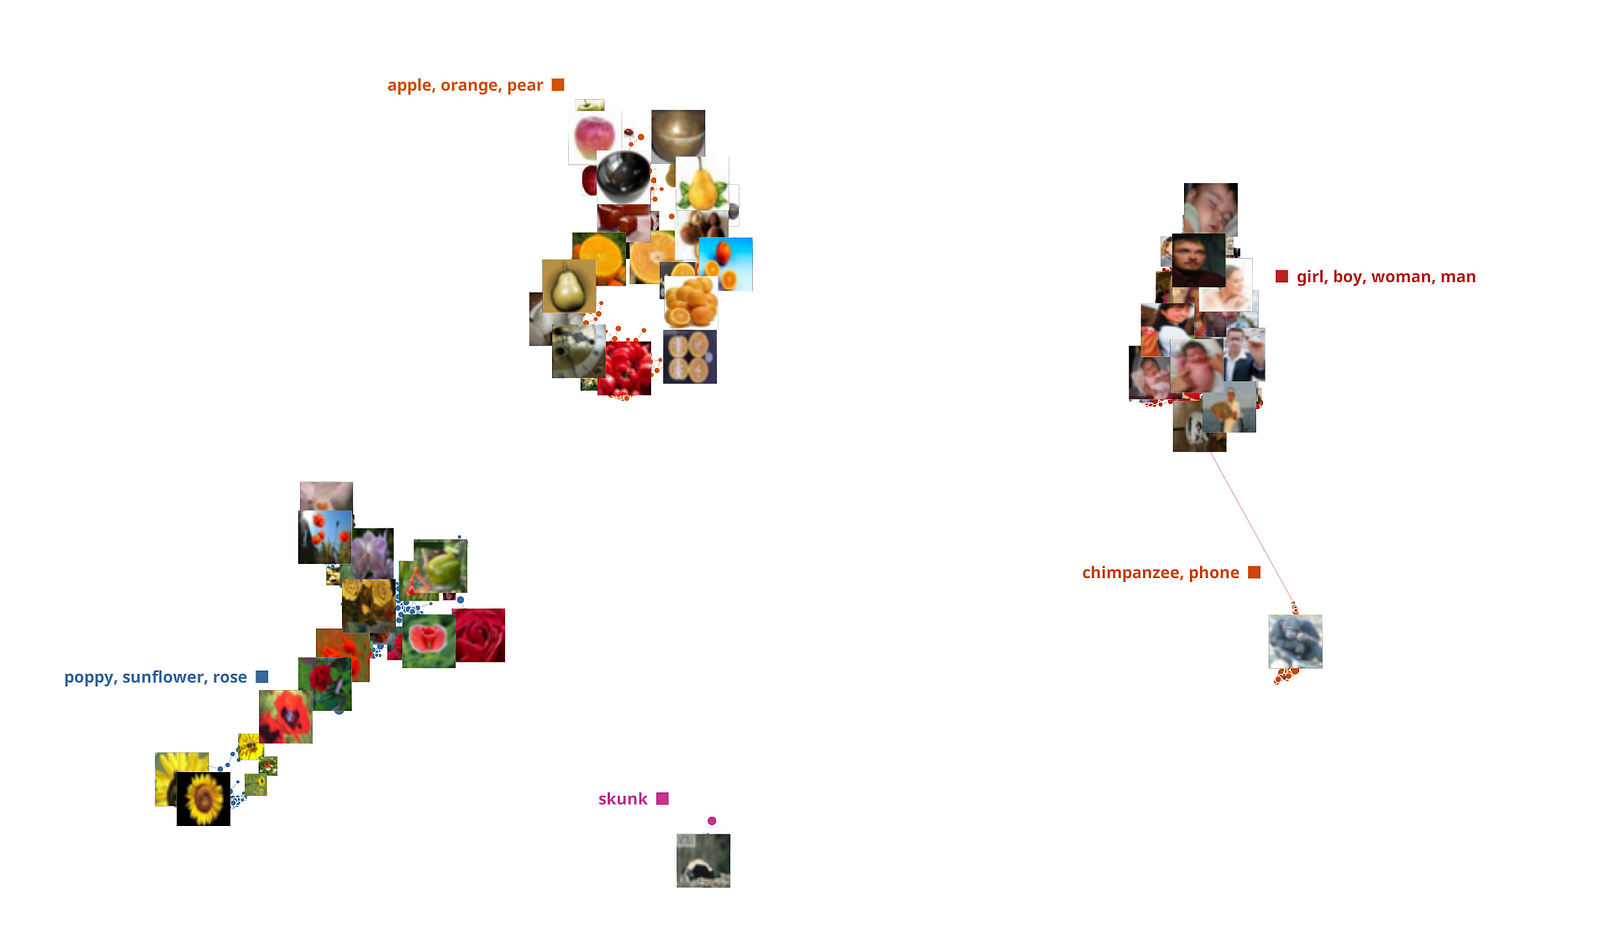
If we zoom in a small part of the structure and overlay actual images, we clearly can see the model was able to learn very complex dependencies and group fruits, flowers and people together:
Text analysis case study
For this case study we're going to use Amazon Fine Food reviews dataset: https://www.kaggle.com/datasets/snap/amazon-fine-food-reviews
The dataset is quite large - 500,000 rows, so we'll use first 100,000 rows for our analysis. Below is the code used to create t-SNE and UMAP visualisations and the result images, all setting are default:
import pandas
import tensorflow_hub as hub
from sklearn.manifold import TSNE
import umap
%matplotlib inline # if executed from Jupyter Notebook

# Loading Universal Sentence Encoder
module_url = 'https://tfhub.dev/google/universal-sentence-encoder-large/5'
embed = hub.load(module_url)

# Loading source data
df = pd.read_csv('amazon-fine-food-reviews.gz',
                  nrows=100000, usecols=['Id', 'Score', 'Text'])

embedded_text = embed(df['Text']).numpy()

# Performing t-SNE embedding with the default settings
sne_embedded = TSNE(n_components=2,
                    n_jobs=8, verbose=1).fit_transform(embedding)
emb_df = pd.DataFrame(sne_embedded)

# Plotting the result
emb_df.plot.scatter(x=0, y=1, c='DarkBlue', figsize=(50,50))

# Performing UMAP embedding with the default settings
reducer = umap.UMAP(metric='cosine', verbose=True)
umap_embedding = reducer.fit_transform(emb_array)
emb_df = pd.DataFrame(umap_embedding)

# Plotting the result
emb_df.plot.scatter(x=0, y=1, c='DarkBlue', figsize=(50,50))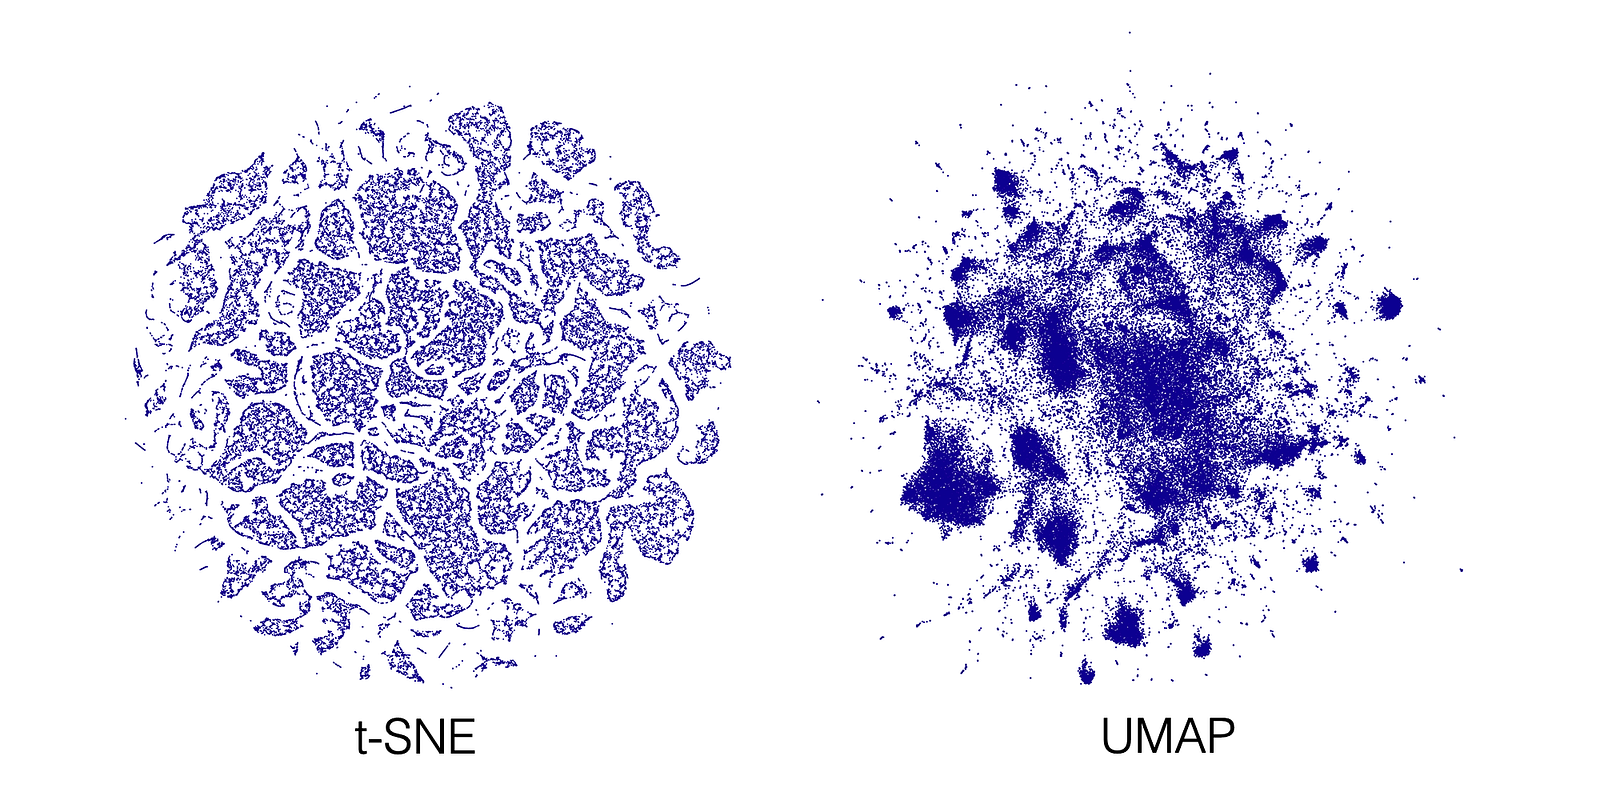
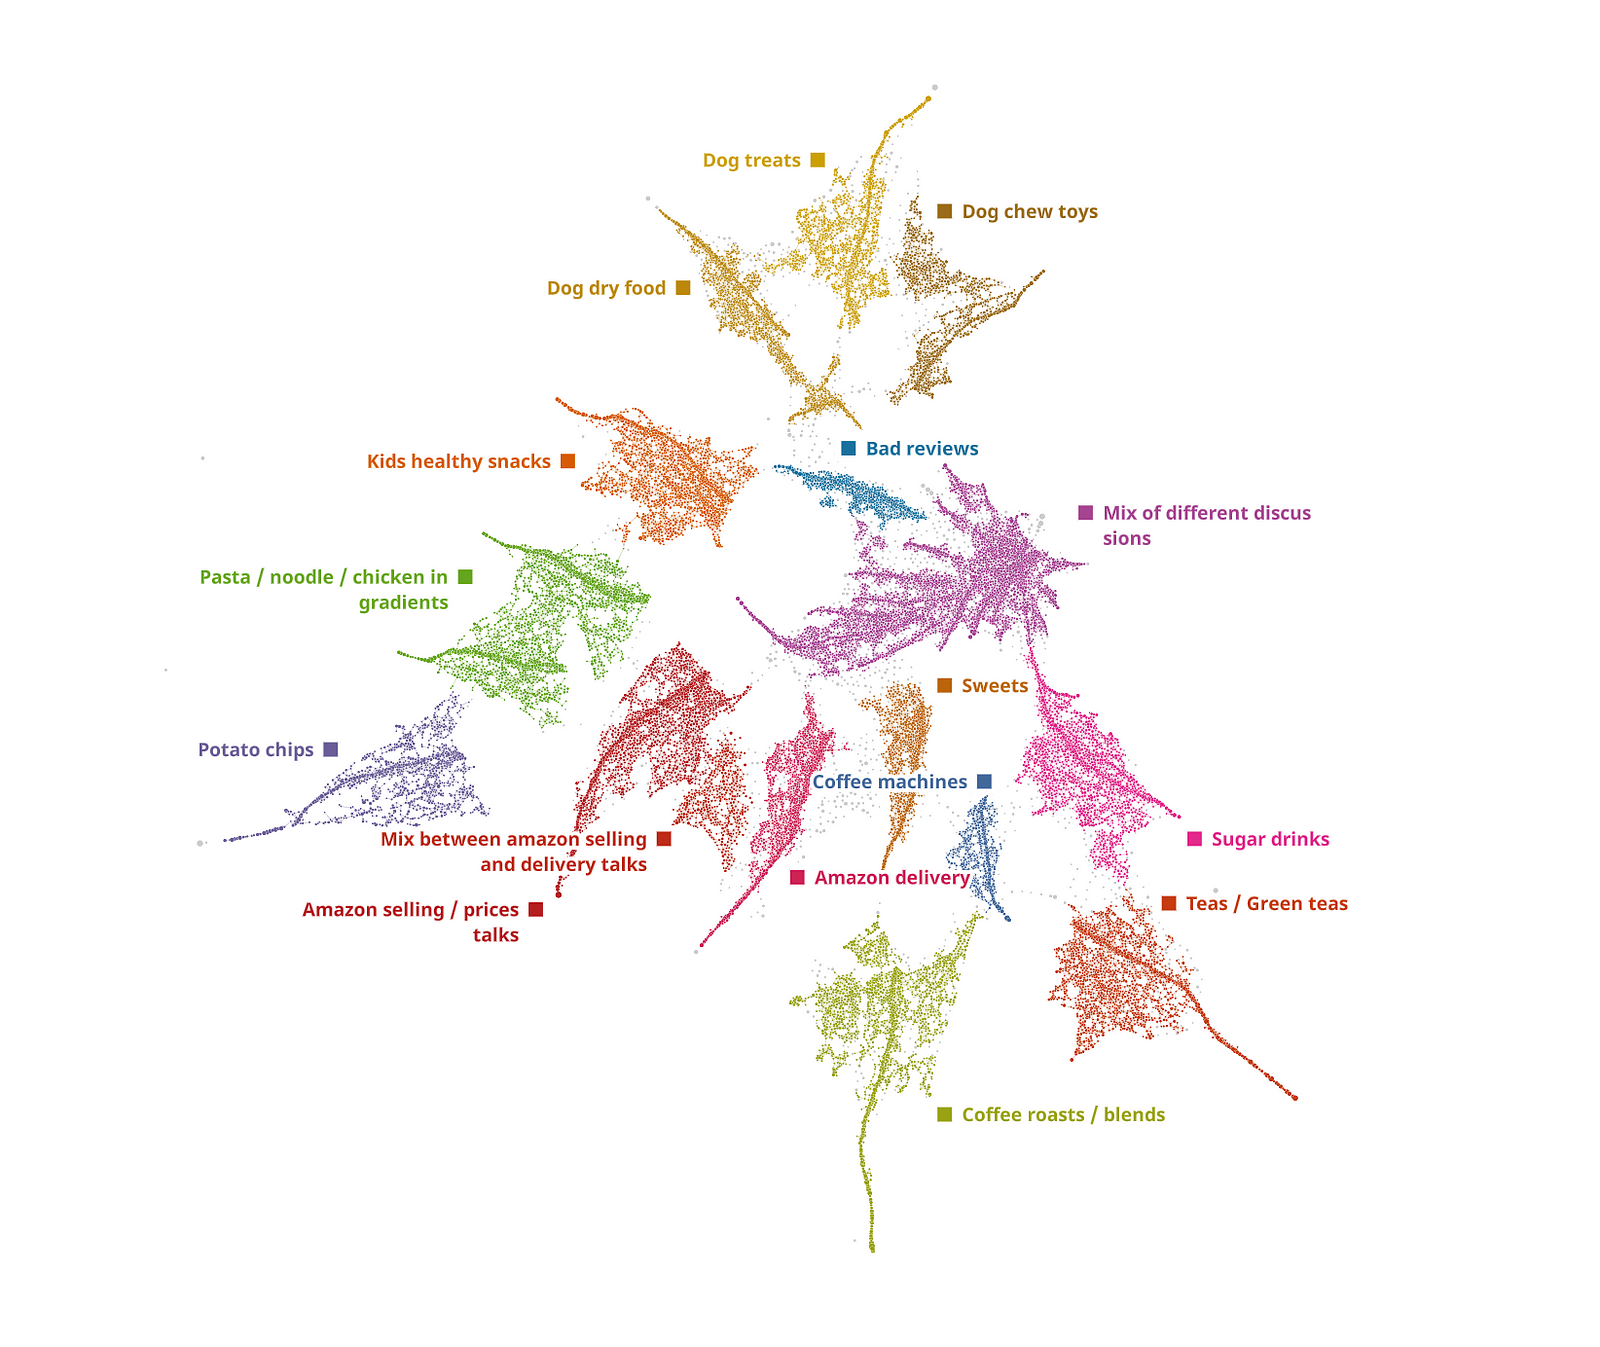
Both embeddings show quite a lot of structure, but it often feels like too much structure for a human to unpack. At the same time, here the example from TDA:
Open Source libraries to try Topological Data Analysis
There are a number of very good open-source libraries if you want to start your journey in TDA:
- scikit-tda: A Python library that provides algorithms for persistent homology, mapper, and other TDA techniques. It also includes visualization tools and datasets for testing.
- giotto-tda: An open-source Python library that provides a complete TDA workflow, including preprocessing, feature extraction, and visualization. It supports a variety of TDA methods, including persistent homology, mapper, and UMAP.
- Mapper: A Python library for the Mapper algorithm for topological data analysis. Available on GitHub.
It is important to note that while open-source solutions can be incredibly useful, there are certain technologies that remain exclusive to certain companies or organizations. Deep TDA, for example, is a unique feature offered by DataRefiner that is not currently available in open-source libraries. Additionally, performing image or time-series analysis requires appropriate data processing, which can be a complex task and may result in analysis issues if not executed correctly.
DataRefiner offers a comprehensive analytical suite for various use cases and has been extensively tested by corporate customers.
Conclusion
In summary, Topological Data Analysis (TDA) combined with self-supervised deep learning is a powerful approach for extracting meaningful information from complex, high-dimensional data. TDA outperforms traditional methods like t-SNE and UMAP in terms of robustness, multiscale analysis, ability to learn complex patterns, parameter-free nature, and scalability. Our case studies show that TDA consistently maintains fine-grained structure, detects and represents global structures, and groups similar data points together. Therefore, we recommend using TDA for analyzing complex data in various fields.